Melbourne Property Market Updates July 2023
by Celene Lam
Melbourne’s home prices are showing signs of recovery, with home prices currently up from the low point in February of this year. While Melbourne’s recovery has not been as rapid as Sydney’s, it also did not experience as significant a decline in 2022.
CoreLogic indicates both house and unit are showing a similar recovery trend so far, with both sectors of the markets finding a bottom in February. Since then, Melbourne house values have risen by 2.6% and unit values are up 2.7%. However, both sectors remained below the recent record high of last year with house values down 8.9% on the January 2022 peak.
The interest rate has been paused for the second consecutive month since June, and inflation rate dropped to levels that were lower than market expected for June quarter. It’s looking increasingly like the interest rate cycle is at or near its peak. It provided some relief for mortgage holders and buyers in the marketplace, fostering hope that the ongoing cycle of rate increases will soon come to an end.
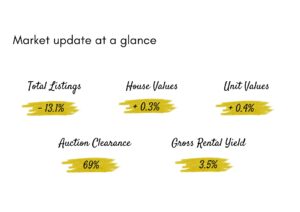
The availability of stock is one of the biggest concerns for buyers in the Melbourne market. Total listing volumes were a little higher through July but remained 10.8% lower than a year ago according to CoreLogic. SQM research data shows that total listings reduced 13.1% in Melbourne. Low stock plus more buyers are causing days on market to trend lower.
Dwelling Values
CoreLogic data showed that Melbourne returned to relatively soft results for housing values in July of 0.3% dwelling values over the month in June.
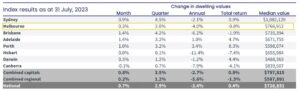
Source: CoreLogic
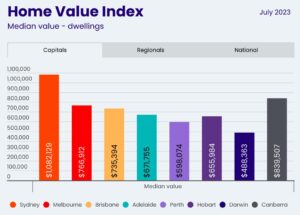
National Home Value Index
Melbourne is still 2nd place with a top home value of $766,912 in the country. The difference between last month’s median value and this month’s median value is $4,375.
House Values
House values grew 0.3% in Melbourne in July. The difference between last month’s median value and the median value this month is $4,910, which reflects market movement in July.
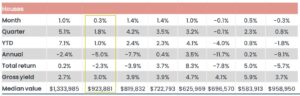
Source: CoreLogic
Unit Values
Unit values grew 0.4% in Melbourne in July. The difference between last month’s median value and this month’s median value is $2,655.
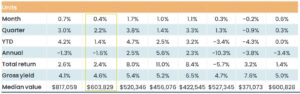
Source: CoreLogic
Listing Volumes
SQM data shows the monthly change of total listings has recorded a decrease of 2.8%. Historically, July listings have fallen 5 times out of the past 10 years. Although the new listings have trended slightly higher in July, it rose by 4.8%, adding 607 new property listings to the market. Over a 12-month period, the property total listings reduced by 13.1%.
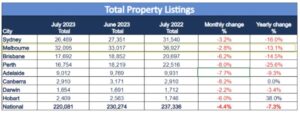
Source: SQM
Rental Market
According to CoreLogic data, units in Melbourne, along with Perth and Brisbane, stand out with the fastest rate of rental growth over the rolling quarter. Unit rents in Melbourne have experienced a notable annual change of +15.3%, while for houses, the annual change is +11.2%. This suggests that there is still strong demand for units in the rental market, contributing to the ongoing price increase in a situation where the supply of rental properties remains constrained.
As per SQM Research data, the vacancy rate is 1.2%, which indicates there is limited expectation for the rental shortage to ease in the immediate upcoming period.
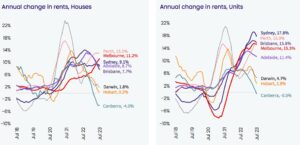
Source: CoreLogic
The PROPERTY of the month !!!
17 Shakespeare Grove, Hawthorn, Vic 3122
Victorian Mansion!
Modern comforts seamlessly blend with heritage charm.
The spectacular established gardens embrace the space, where the inviting pool area offers a taste of resort living.


We hope our Melbourne property market overview has been helpful for you.
If you would like to find out more about the current market or our services, please click here to contact our team.